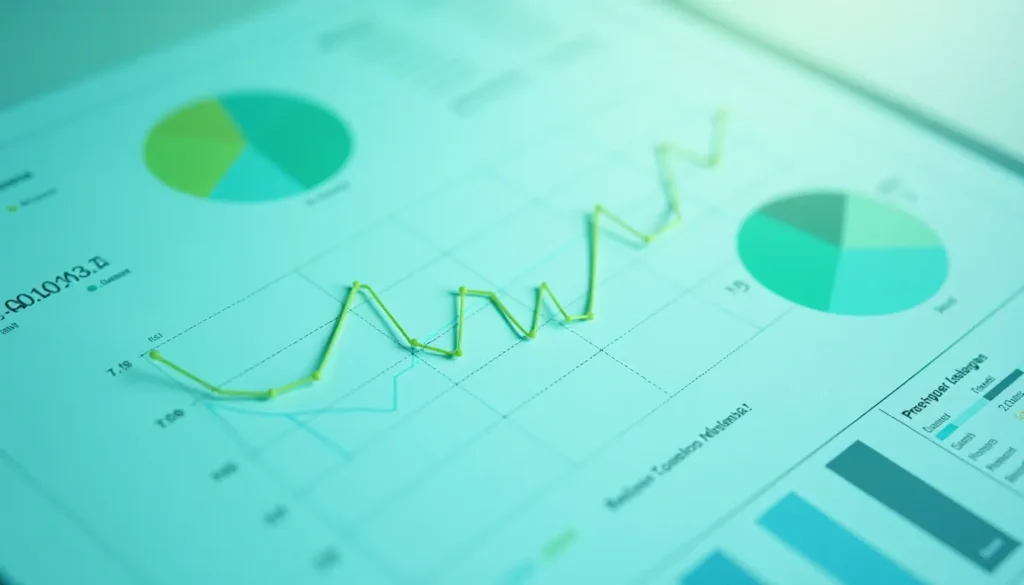
Google Data Studio, now rebranded as Looker Studio, is a powerful tool in digital marketing, allowing the creation of dashboards that integrate data from various sources. In this article, we will explore how this platform facilitates the visualization of metrics and the preparation of real-time reports, offering integrated analyses to boost your marketing strategies.
What is Google Data Studio
Google Data Studio is an essential tool for marketing professionals seeking to enhance their strategies through data analysis. Since its launch in 2016, the platform, now known as Looker Studio, has become a powerful resource for building customized reports and dashboards. Its main goal is to offer an intuitive interface that allows users not only to connect data from diverse sources but also to generate valuable insights quickly and effectively.
With Google Data Studio, it is possible to integrate information from multiple platforms, such as Google Analytics, Google Ads, social media, and databases, all in one place. This centralization capability transforms complex data into graphical representations, facilitating interpretation and analysis of information. The flexibility in report modeling enables each marketing campaign to have its specific metrics monitored, contributing to a deeper understanding of performance in real time.
Moreover, access to readily available templates and advanced customization options ensure that even those with little experience in data analysis can effectively use the tool. For marketing, this visualization capability is crucial as it allows for precise monitoring of implemented actions, enabling ongoing adjustments and optimization.
With each update, Google Data Studio has become more robust, introducing features that enhance the user experience. Thus, by exploring the potential of this tool, companies can transform data into strategic decisions. Consequently, the next steps to maximize results are increasingly integrated with the use of efficient dashboards.
Benefits of Creating Dashboards
Dashboards provide a clear visualization of relevant data, which is fundamental to marketing strategy. These interactive panels can be shaped to meet the specific analysis needs of campaigns. By structuring information into an intuitive visual format, it simplifies the interpretation of large volumes of data, facilitating the detection of trends and patterns that might otherwise go unnoticed. In this way, marketing teams can quickly identify which campaigns are performing well and which require adjustments.
In addition to clear visualization, one of the primary benefits of creating dashboards is the ability to monitor KPIs in real time. This is essential as it allows professionals to adjust strategies and tactics as data updates. If a CPC (cost-per-click) campaign is performing below average, a quick response with data analysis enables immediate optimization, preventing resources from being wasted on ineffective actions. Thus, efficient dashboards act as allies in maximizing the return on investment (ROI) of marketing activities.
Moreover, the communication of results is significantly facilitated through dashboards. Graphical representations and well-organized metrics allow the team and stakeholders to quickly understand campaign performance. This aspect is vital, especially when it comes to presenting reports to managers or investors, who may not have the same familiarity with technical data. A well-constructed dashboard is a powerful tool for telling a compelling story about how campaigns are performing and where opportunities for improvement lie.
Another important point is the possibility of customizing dashboards. Each team can adapt their visualizations according to their priorities and areas of focus, whether in engagement, conversion, or reach. For example, one department may prioritize social engagement metrics, while another may focus on revenue. This flexibility ensures that every professional is attentive to what truly matters for the success of their area.
Dashboards not only organize but transform raw data into meaningful information. Consequently, this transformation allows decisions to be based on concrete evidence, mitigating intuition and highlighting the importance of data analysis in modern marketing management. As we move forward, it will be essential to understand how data connectivity in Looker Studio can further empower the creation of impactful and informative dashboards.
Connecting Data from Different Sources
The connection of data in Looker Studio is one of the most powerful aspects that marketing professionals can leverage to maximize the effectiveness of their campaigns. The integration of data from various sources facilitates a comprehensive analysis of performance, allowing each specialist to access a holistic view of all their metrics in one place. This ability to consolidate information from platforms such as Google Analytics, Google Ads, Facebook Ads, among others, ensures that decisions made are based on fresh, relevant data.
When you connect Looker Studio to different platforms, every update is instantly reflected in your dashboards. This means that marketing professionals can track campaign performance in real time, eliminating the need for manual data collection. With just a few clicks, it is possible to visualize new metrics, compare results from previous campaigns, and identify emerging trends. The agility provided by this connection allows professionals to quickly adapt, adjusting their strategies based on concrete data.
An interesting aspect of data connectivity is the ability to customize reports to meet the specific needs of each team or project. For instance, a team focused on paid media might prefer to concentrate on metrics such as cost per click (CPC) and conversion rate, while a content marketing team may prioritize engagement and organic traffic data. Looker Studio allows the creation of different views and dashboards to meet these diverse needs while maintaining consistency in data sources.
Furthermore, the ability to connect data from multiple sources offers a valuable opportunity for cross-comparison. By harmonizing data from paid ads with information from organic traffic, for example, you can gain deeper insights into consumer behavior. This analysis can reveal which ads attract visitors who subsequently convert through organic or social search, providing a clearer view of the customer purchase cycle.
However, for this connectivity to be truly effective, it is crucial to maintain data quality. The integrity of information can be compromised if the data from different sources are inconsistent or outdated. Therefore, establishing regular review and validation processes is essential to ensure that the metrics reflected in your analyses are accurate.
This dynamic capability for data connection not only transforms how marketing professionals analyze their results but also creates a collaborative environment where insights are quickly shared and discussed. As we move forward, it will be essential to consider how real-time reporting can further strengthen this approach, allowing for agile responses to market fluctuations and consumer behavior.
Real-Time Reporting
Real-time reporting is essential for tracking campaign performance. Looker Studio enables immediate visualization of results, helping to quickly identify what is working and what needs adjustment in your strategies. This agility is crucial in a landscape where market conditions can change dramatically within hours. With dynamic dashboards, you can observe user interactions and ROI in real time, providing a capacity that can differentiate your brand from the competition.
One of the main advantages of real-time reports is the ability to promote an agile response to performance variations. For example, if a campaign is performing below expectations, you can immediately make adjustments. This means that instead of waiting for periodic reports that usually take days to become available, the necessary information is at your disposal instantly, allowing for quicker, informed decisions. Additionally, this proactive approach can significantly reduce resource waste on campaigns that are not yielding results.
Looker Studio also offers an intuitive interface, making it easy to customize real-time reports. You can include specific KPIs, graphs, and tables that meet the needs of your marketing team. For example, you can monitor not just clicks and impressions, but also more complex metrics such as conversion rate, cost per acquisition, and other important indicators. The detailed tracking of these metrics in real time ensures that the marketing strategy aligns with business objectives.
Moreover, the use of real-time reports fosters a data-driven culture within the team. By promoting greater visibility about what is happening in campaigns, all team members can contribute more efficiently to the continuous optimization of results. This not only improves internal collaboration but also allows decisions to be based on concrete data, minimizing reliance on assumptions.
With Looker Studio, it is possible to integrate data from different sources, ensuring that you have a comprehensive view of your campaign performance. This integration proves even more valuable when considering the impact of various channels on the customer journey. As you move to the next level, efficient metric visualization becomes indispensable to transform this information into clear, actionable insights.
Efficient Metric Visualization
Efficiently visualizing metrics is crucial for the success of marketing campaigns. With the growing amount of available data, the need for a tool that synthesizes and facilitates the interpretation of this information becomes evident. Google Data Studio, now known as Looker Studio, offers a variety of interactive graphs and tables that help illustrate data in a comprehensible way. Choosing the right visualization can enable quick, accurate insights, allowing marketing teams to act swiftly.
One of the first steps for effective visualization is selecting the appropriate graph type. Bar charts, for example, are great for comparing categories, while line graphs are ideal for showing trends over time. Pivot tables can provide a detailed and specific view, allowing users to dive into the data. Looker Studio also offers the possibility of integrating combined graphs, allowing multiple metrics to be visualized in a single graph, enhancing comparative analysis.
Moreover, the utilization of filters and segmentations in Looker Studio plays a fundamental role. These features allow you to adjust the visualization to focus on specific areas of your target audience or different time periods. This customization is valuable for understanding how different segments respond to specific campaigns. With the ability to segment data, it is possible to identify which strategies are delivering the best results for different audiences, adjusting campaigns in a more strategic manner.
Another important aspect of metric visualization is the clarity of the information presented. Using colors and labels appropriately in your graphs and tables can avoid confusion and make the data more accessible. Combining appealing visual elements with meaningful data results in dashboards that not only inform but also engage collaborators and stakeholders.
Finally, the interactivity of visualizations in Looker Studio provides a richer experience. Users can access relevant information with just a few clicks, allowing for a deeper exploration of the data. This interactivity not only retains user attention but also engages them in analyzing campaign results, promoting a more complete understanding.
The next step in effectively using Looker Studio is to ensure integrated analyses that gather data from various sources, facilitating the formation of a comprehensive and grounded view of marketing performance. The interconnection between metrics and the integration of different data will be fundamental for more strategic and efficient decisions as campaigns evolve.
Integrated Analyses for Informed Decisions
Integrated analyses in Looker Studio are one of the most powerful tools for modern marketing, allowing you to create a robust and cohesive data ecosystem from diverse sources. By gathering information from different channels, such as social media, Google Ads, and email marketing, for example, you obtain a complete view of your performance. This holistic approach not only facilitates the visualization of metrics but also enhances the ability to identify trends and correlations that might otherwise go unnoticed.
The ability to integrate data becomes crucial, especially when it comes to optimizing campaigns. Through interactive dashboards, you can compare the performance of different strategies in real time, allowing for immediate adjustments. Whether analyzing which type of content generated more engagement or which channel provided the highest return on investment, integrated analysis provides practical, applicable insights. This results in informed decisions since you can base your choices on concrete data rather than guesses or subjective feelings.
Furthermore, integrated analyses offer the opportunity to segment data more effectively. You can group information by demographics, consumer behavior, or geographic location, allowing a deeper understanding of how different audiences interact with your campaigns. This level of detail is essential for creating more targeted and personalized marketing strategies. Thus, you can increase the relevance of your communications, achieving greater impact and effectiveness in marketing actions.
Another significant advantage is the ability to monitor performance over time. With dashboards that update data in real time, you can follow the evolution of your campaigns and adjust your approach as needed. This is especially important in a marketing environment that frequently evolves, where new practices and trends emerge every moment. The flexibility provided by Looker Studio allows you not only to react to these changes but also to anticipate them, positioning your company as a reference in innovation within the market.
Lastly, integrating data into a single dashboard not only improves operational efficiency but also promotes a culture of data-driven decision-making within the marketing team. By transforming numbers and information into understandable narratives, all members can contribute valuable insights that elevate campaign performance.
Thus, as we move to the next section, it is crucial to observe that this ability to transform data into informed decisions is just the beginning of the journey. After all, how we leverage Google Data Studio defines not only immediate success but also lays the groundwork for sustained long-term growth.
Conclusion and Call to Action
In conclusion, Google Data Studio transforms confusing data into useful information. With the growing amount of information available in marketing campaigns, the ability to synthesize and visualize this data clearly becomes essential for success. By utilizing this powerful tool, it is possible not only to monitor performance indicators but also to interpret trends and predict consumer behaviors. This enables marketing professionals to make real-time adjustments and effectively optimize their strategies.
The dashboards of Google Data Studio stand out for their flexibility and customization, enabling each marketing team to create visualizations that meet their specific needs. By integrating data from various sources, such as social media, Google Analytics, and email marketing platforms, it is feasible to build a comprehensive picture that aids in identifying opportunities and challenges, leading to more informed and effective decisions.
Through interactive and dynamic reports, stakeholders can explore data intuitively, which facilitates communication between teams and presenting results to clients or executives. This transparency reinforces collaboration and aligns everyone toward common goals. Moreover, with the ability for automatic data updates, professionals have access to real-time information, ensuring that decisions are made based on the most current data.
Therefore, adopting Google Data Studio is not just an option but a necessity for those seeking to maximize the performance of their campaigns. For more effective consulting in digital marketing, get to know XTYL and enhance your results. This step can be decisive in the pursuit of superior performance and achieving ambitious business goals, paving the way for continuous success in marketing initiatives.
Conclusion
In summary, Looker Studio transforms data into valuable insights for marketing campaigns. Through the creation of interactive dashboards and real-time reports, companies can optimize their data analysis and improve decision-making. Invest in your data visualization skills and watch your marketing strategy thrive.